[Please also see a later entry on the Upper North Grain weather record, along with a link to the published paper – GC, August 2018]
One of the great resources we have here in Geography at the University of Manchester, is our research catchment in the Peak District where we study a range of issues including peatland erosion, heavy metal transport and carbon sequestration.
The catchment, Upper North Grain (or affectionately called UNG), is a small headwater catchment dominated by blanket peat and with asosociate heather, bilberry and cotton grass vegetation. The site, on the National Trust’s High Peak estate, has been instrumented for over a decade with a range of monitoring equipment including automatic weather station, river discharge and ongoing carbon monitoring. In addition to all the active research projects, we also use the site as a teaching resource for our undergraduate and postgraduate programmes – you haven’t really had a Geography @ Manchester experience until you’ve been to UNG in the pouring rain!
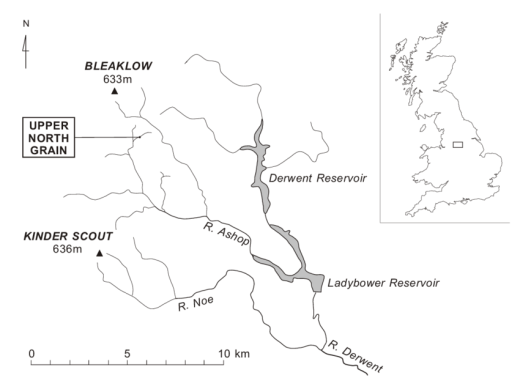
Location of Upper North Grain (Pawson et al., 2008)
One of the bits of work I’m doing at the moment (during the relatively quite summer period before term starts again) is looking at collating the site’s meteorological records for the past decade and making sure that they are all there and up to scratch. I know it sounds like a dull task, but it is a necessary job plus it does throw up some interesting weather conditions at the site. For example, the coldest temperature recorded in the catchment was -8.9°C whilst the wettest day in the catchment was 25th June 2007, where the daily total was over 95 mm (3 & 3/4 inches in old money). While these are interesting factoids in their own right, we can use the extremes as well as the long-term means to look at how the catchment behaves in response to meteorological conditions.
The next step in ensuring a complete database is to fill in some of the gaps in the data. There can be a number of reasons for gaps in the data but the most common are: failures with the data logger (often power issues) or if the station was down for routine maintenance. To get around these gaps we need to fill in the gaps with data from a comparable site in the region. We take the two datasets and compare the site where data is available for both and create a regression equation between the two. We can then fill in the gaps in our database by using the regression equation and the data from the missing time period from the other station.
Once this task is done, I’ll then be able to look at the long-term trends over the past decade and compare it against our hydrological monitoring and carbon budgets. Hopefully I’ll be able to add some images to the blog at a later date once I’ve tidied everything up.
